4.18. A NATURAL CATASTROPHE STUDY
A simulation model with Vensim
 Woodland is a prosperous region located in a temperate area with abundant vegetation. Its inhabitants lead a happy and comfortable life. Its total population is 1,000,000, a figure which has remained stable in recent years.
Currently 40% of its population are young people under 20 years old, 50% are adults between 20 and 70 years old and the others are elderly people.
Furthermore, we know its population parameters to be the following: the life expectancy is 80 years, the birth rate of the adult population is 6% per year and the mortality rate is 2.5% in young people and 2% in adults. All of these parameters have remained stable and are not expected to change in the future.
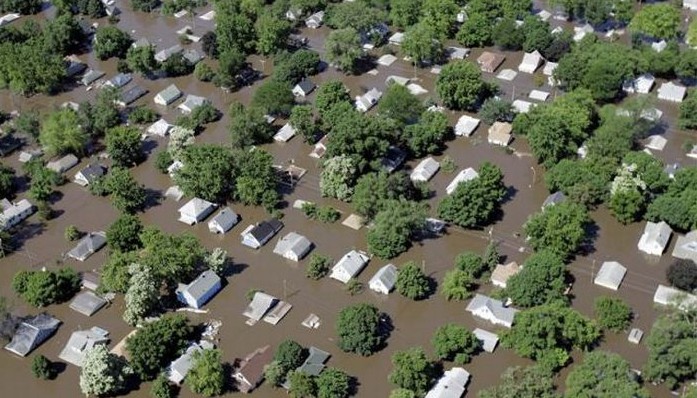
An ill-fated night in the summer of 2005 a terrible fire breaks out and over the course of a long week, the fire advances uncontrollably, devastating everything in its path. Emergency services manage to help all of the young and elderly people to safety, but when the fire is put out, they discover that the total number of victims is 100,000 people, all of whom are adults.
We would like to make an estimation of how the total number of people in Woodland will evolve following the catastrophe, knowing that the population parameters (life expectancy, birth rate and mortality rate) will remain constant. More specifically, we must determine the number of years it will take the region to return to its population of 1,000,000 people.
To carry out this study, we will use a simple simulation model in which the start date will be set as the year 2000 and the time frame will be 50 years.
Taking into account the parameters we have been given, we will construct an initial version of the model based on a stable population from 2000 to 2050. Then, in a second version, we will introduce the death of 100,000 adults in the year 2005 and evaluate the impact that it will have up to the year 2050.
In the next page we have a diagram that allows us to reproduce the situation of a stable population.
This model can be used to reproduce a stable situation. Below, the model will be modified to simulate the catastrophe. The initial effect will clearly be a reduction of the population from 1,000,000 to 900,000 people, but the future evolution will not yet have been determined. Naturally, our intuition will give us an indication of how this evolution will progress. Before continuing, we should note the approximate number of years we predict it will take the population to return to its initial figure of 1,000,000 people.
To simulate the effects of the 2005 catastrophe, resulting in the deaths of 100,000 adults, we must create a new adult output flow. Using the PULSE function, we indicate that the period will be 2005 and the duration will be 1 period. Furthermore, it will be necessary to modify the adult equation to include the new flow.
We can see the details of the PULSE function in the Functions, Tables and Delays chapter, but basically it takes on the value of 0 until the period t (2005 in this case), and for n periods (1 in our model) it takes on the value of 1. We want to simulate the loss of 100,000 people, and for this reason we multiply the result of the PULSE function (which is 1) by the figure 100,000.
Before simulating the model we should ask ourselves what type of situation we expect to see in 20 years time, in other words:
a) The population will remain stable at 1,000,000 - 100,000 = 900,000
Woodland is a prosperous region located in a temperate area with abundant vegetation. Its inhabitants lead a happy and comfortable life. Its total population is 1,000,000, a figure which has remained stable in recent years.
Currently 40% of its population are young people under 20 years old, 50% are adults between 20 and 70 years old and the others are elderly people.
Furthermore, we know its population parameters to be the following: the life expectancy is 80 years, the birth rate of the adult population is 6% per year and the mortality rate is 2.5% in young people and 2% in adults. All of these parameters have remained stable and are not expected to change in the future.
An ill-fated night in the summer of 2005 a terrible fire breaks out and over the course of a long week, the fire advances uncontrollably, devastating everything in its path. Emergency services manage to help all of the young and elderly people to safety, but when the fire is put out, they discover that the total number of victims is 100,000 people, all of whom are adults.
We would like to make an estimation of how the total number of people in Woodland will evolve following the catastrophe, knowing that the population parameters (life expectancy, birth rate and mortality rate) will remain constant. More specifically, we must determine the number of years it will take the region to return to its population of 1,000,000 people.
To carry out this study, we will use a simple simulation model in which the start date will be set as the year 2000 and the time frame will be 50 years.
Taking into account the parameters we have been given, we will construct an initial version of the model based on a stable population from 2000 to 2050. Then, in a second version, we will introduce the death of 100,000 adults in the year 2005 and evaluate the impact that it will have up to the year 2050.
In the next page we have a diagram that allows us to reproduce the situation of a stable population.
This model can be used to reproduce a stable situation. Below, the model will be modified to simulate the catastrophe. The initial effect will clearly be a reduction of the population from 1,000,000 to 900,000 people, but the future evolution will not yet have been determined. Naturally, our intuition will give us an indication of how this evolution will progress. Before continuing, we should note the approximate number of years we predict it will take the population to return to its initial figure of 1,000,000 people.
To simulate the effects of the 2005 catastrophe, resulting in the deaths of 100,000 adults, we must create a new adult output flow. Using the PULSE function, we indicate that the period will be 2005 and the duration will be 1 period. Furthermore, it will be necessary to modify the adult equation to include the new flow.
We can see the details of the PULSE function in the Functions, Tables and Delays chapter, but basically it takes on the value of 0 until the period t (2005 in this case), and for n periods (1 in our model) it takes on the value of 1. We want to simulate the loss of 100,000 people, and for this reason we multiply the result of the PULSE function (which is 1) by the figure 100,000.
Before simulating the model we should ask ourselves what type of situation we expect to see in 20 years time, in other words:
a) The population will remain stable at 1,000,000 - 100,000 = 900,000
b) The population will recover its initial value within a few years
c) The population will recover its initial value over the course of many years
It is important to make a prediction about the evolution we expect to observe in the model before running the simulation, because if we obtain results which confirm our prediction, it gives us a foundation on which to build future studies. However, the results may contradict our prediction. In this case, if there are no errors in the model (which must be verified), some thought should be given to the assumptions on which we have based our predictions and they should be reconsidered.
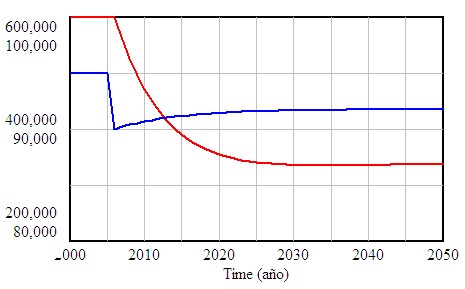
In this study, the evolution of the population is not consistent with the situation we expected, given that the population neither remains stable at its new level nor returns to its original level, but decreases even further before stabilizing itself.
The model clearly shows us that the evolution of the total number of people is not consistent with our expectations. The population neither remains stable at 900,000 people nor returns to the original figure over the course of the extensive time frame we have defined, but stabilizes at a figure clearly lower than 900,000 people.
We can monitor what happens in the different collectives using the graphs which show us the evolution of one variable and the others which influence it.
|

 See the book