4.14. MANAGEMENT OF INNOVATORY COMPANIES
A simulation model with Vensim
 In this work we can see the distinguishing characteristics of innovating companies and the steps followed in the construction of the model, the structure of the latest version, the behaviour obtained from this structure and the simulations and analyses of sensitivity that have been made. Lastly, they are explained the most suitable policies and the objectives which should be followed by innovating companies.
The specialists and the bibliography that deal with this subject indicate that the distinguishing characteristics of innovating companies are: small size, environment with rapidly changing technology, high technological risk, need for investment in R+D, government aid policies and programs, difficulty of access to raw materials, difficulty in obtaining qualified staff, difficulty in the channels of distribution, markets without protective borders, attractive margins, financial difficulties, and need for government aid.
The model is divided into three main areas: the R+D Area, the Production and Market Area, and the Financial and Management Area. We can see how the R+D expenses make it possible to employ scientific staff who generate lines of production which lead to deliveries based on the current production capacity. Moreover, the quality of the products influences the price, and this, combined with the deliveries, defines the turnover. The turnover makes it possible to obtain a profit.
The cash situation limits the volume of the production capacity. In turn the fixed assets, which is the accounting expression for the production capacity, influence the desired profit. When this is higher than the real profit, there tend to be cuts in the R+D expenditure. Although I will explain the main elements below, an overall view allows us to observe the existence of positive and negative loops. The former will by themselves lead the company to an exponential growth or a rapid collapse. The latter will act as stabilizers of the former.
We can clearly see the inputs and outputs of each area. Thus, the R+D Area receives the input of the R+D expenditure from the Finance and Management Area, giving as an output products of a certain quality. the Production and Market Area receives these outputs, together with the cash situation, and gives as an output deliveries at a certain price and production capacity. Lastly, on the basis of these inputs the Financial and Management Area offers a given R+D expenditure as an output. We will now see the main elements and relations of the model.
THE RESEARCH AND DEVELOPMENT AREA
This is a key area in the model, showing the elements which affect the generation of products. It includes:
Scientific staff: These are persons who may be employed on the basis of the R+D expenditure. It is divided into two groups, the Scientific Staff devoted to R+D and the Scientific Staff devoted to production. Although initially all the scientific staff are devoted to R+D, after the launching of the first line of products they are divided into two groups.
Scientific progress: The scientific progress of the company develops on the basis of the number of employees devoted to research, and is hindered by the scientific difficulty of the chosen area of work and by the scientific level of the R+D work of the company.
Scientific difficulty: The degree of scientific difficulty of the area in which the company wishes to introduce its products, which may be high if it wishes to offer products with the latest technology, or low otherwise.
Scientific level: The scientific advances of the environment. Supposing that there is a fluid relation with the environment, the scientific level of the company increases according to both the scientific advances of the company and the advances in the environment. It is initially higher than that of its environment because it includes research previous to the creation of the company.
Potential quality of the products: This evolves according to the scientific level of the company and the advances in production quality. The increase in lines of products leads to diseconomies which lead to lower increases in quality.
Real quality: This is equal to the potential quality at the time the line of products is launched, and is considered not to vary until the launching of a new line.
Quality gap: Is the percentage by which the technological quality of the company's products exceeds that of the environment. This gap has a clear influence on the price of the product.
Non-applied technological gap: This includes the research efforts devoted to creating a new line of products. It has not yet been applied as the desired technological advantage over the knowledge of the environment has not yet been reached. This increases according to the difference between the scientific level of the company and the scientific level of the environment. It diminishes as the product lines are applied.
Product lines: This indicates the number of lines which have been successful and serve as a basis for creation of products. In these companies the products are not generated in isolation, and one product type generates a diversity of products which meet the most common requirements of the customers. Product lines are generated when the Non-applied Technological Gap exceeds the scientific level of the environment by a desired value. This constant permits the simulation of different positions of entry in the market.
Products: After a line has been obtained, the products generated are no more than different applications of a single scientific base - the line of research - for the specific problems of the customers. This variable covers the products which are marketed, not those which may be marketed, as the volume of investment is limited. Thus, products are only launched while the cash available makes it possible to finance the new investments in fixed assets. Due to the dynamism of this sector, it is supposed that products not launched a certain time after the line of research has finished will not remain in the portfolio, and the company loses the opportunity to launch them. The flow of products shows a brief delay with regard to the appearance of the product lines.
PRODUCTION AND MARKET AREA
This area contains the main aspects of production and sales.
Production capacity: This increases according to the launching of products. The production capacity determines the flow of deliveries, since production stocks are not considered to be significant.
Orders: These are calculated on the basis of the number of products, the number of customers and their consumption. A constant unit consumption per customer is assumed during the period studied.
Deliveries: This coincides with the volume of orders if the production capacity so permits. Orders which exceed the capacity are considered as lost. If the orders exceed the production capacity, this leads to what we will call Production Tension. The cash situation permitting, after a certain delay this tension will lead to an extension of the production capacity.
Price: It is considered that the company cannot significantly influence the reference price, but it can obtain a higher or lower price according to the quality gap of its products.
Customers: This deals with the number of customers of the company. The company starts to find customers in the desired niche after obtaining the first product line.
Fixed Assets: The value of the investments in fixed assets such as machinery and installations. It is difficult to find outside finance for these investments, and the company must therefore use its own capital. The fixed assets increase according to increases in the production capacity, and decrease according to amortization and the official aid received. They are of great importance in the calculation of the desired profit.
FINANCE AND MANAGEMENT AREA
This deals with the accounting and management aspects of the company. The basic aspects are:
Turnover: The deliveries times the price.
Profit: The concept of operating profit. It is calculated by subtracting from the turnover the cost of raw materials, the cost of production staff, the general expenses - which include research and marketing - and depreciation. Neither cash income nor expenses are considered as they distort the indicators of the evolution of the company with external factors, without making a significant contribution. They are not considered as financial costs since this type of company is unlikely to find outside finance when they have to face liquidity problems.
Cost of raw materials and the cost of production staff: These are fixed percentages of turnover. It has been considered that two aspects come together at this point: firstly, a certain experience curve should permit a lower consumption of raw materials and labor; secondly, price of products reductions must be taken into account. The combination of these two aspects allows us to establish fixed percentages of turnover.
Net Worth: This is the net book value of the company at any given time, as the sum of the initial capital plus the annual profits, according to the policy of profit distribution. According to the profit distribution policy, the model calculates the profit to be carried to net worth when the profit is positive, and apportions losses when they occur.
Profit distribution: This deals with the company policy of distribution or reinvestment of profits.
Desired Profitability: This percentage is applied to the net worth of the fixed assets, in order to obtain the desired profit.
Profit Gap: The relative difference between the desired profit and the real profit.
Liquidity: The net worth not applied to fixed assets. According to the net worth, this establishes the maximum amount of fixed assets which the company can acquire, so that by financial orthodoxy the fixed assets are not financed with outside funds.
General expenses: Expenses of research and marketing. This also includes repayment of official aid received for research, since, unlike aids for investment, this is in the form of loans.
Loans for research and development: The amount that the company devotes to R+D. Added to the net official aid to R+D, this comes to the R+D expenditure. The management of the company may alter the R+D budgets with a certain elasticity. The reasons for altering the R+D budget lie in the gap between the real and desired profits. Thus, when the real profit does not reach its objectives, the management tends to reduce the R+D budgets, and when it exceeds them it does the opposite.
Marketing: The expenditure needed to publicize the products and inform potential customers of their characteristics. This depends on the number of products and the customer niche.
Desired niche: The group of customers to which the company wishes to aim its products. It may be very wide, with high marketing costs, distribution networks, etc., or very small,so that the proximity of the company gives it a decisive competitive advantage over others.
Official aid to R+D: Five-year interest-free loans, up to 50% of the costs of the R+D project.
R+D costs: Includes the R+D budget, plus net official aid, i.e. the input of aid plus the return of the loans received.
Lastly, two indicators of the situation of the company are obtained:
Margin: This is calculated as a percentage of Profit/ turnover.
R+D costs/Turnover: As the study deals with innovating companies, the ratio of R+D to Turnover can give us an idea of the importance of this factor in the running of the company.
BEHAVIOUR
Leaving aside the period in which the founders of the company carry out the initial research and market research and manage to find the necessary capital, we can observe three clearly differentiated stages.
The first begins when the company starts to operate, and lasts until the first product line is obtained. It is characterized by intensive R+D activity focused exclusively on solving scientific problems so that the company can obtain a certain line of products or services. The only challenge is to obtain the first line of products before the initial capital is exhausted.
The second stage is marked by the launching of the first line of products. This stage is characterized by the need to acquire production machinery, recruit new production staff, start production and transfer scientific staff from R+D to production. Marketing and sales costs must also be met. This is all dealt with in an environment of serious cash limitations and capital. The challenge thus lies in creating a production structure in an environment of serious financial difficulties.
The third stage is marked by the birth of new product lines. In this stage there arise problems of distribution of the resources which the company is generating between the different agents who require them. The area of R+D will also request more funds to recover the initial levels of research, the area of production will request funds to increase its production capacity and close the gap between sales and production, and the representatives of the capital, after a long wait, will wish to obtain a high remuneration for the risky investment that they have made. Indeed, the final challenge consists in achieving an effective distribution of the resources.
We will now take a brief look at the evolution of the main elements of the model over a period of 120 months, or 10 years. Firstly, we can see the evolution of the scientific staff. Their behaviour is highly influenced by the obtaining of the first line of products. At this time two phenomena occur: some of them begin to be laid off due to the investments and expenses the company must make and others are redistributed, some of them being transferred from R+D to production.
Let us now see the evolution of the scientific level of the company, the scientific level of the environment, the potential quality and the real quality. The scientific level of the environment is approximately doubled in 10 years and, as a result of the company's research, the scientific level of the company is always above that of the environment. The potential quality of the products is lower than the company's scientific level, since the products cannot incorporate all the company's knowledge. The real quality coincides with the potential quality at the time when new lines of products are launched.
We can see how the quality gap between the real quality and the scientific level of the environment is at a maximum after the launching of new lines of products, and then decreases. Lines of products appear successively when the scientific level of the company is higher than the scientific level of the environment, according to the concept of the Non-applied Technological Gap defined above. The products are generated after new lines are obtained. The number of these varies according to the availability of cash. The products which cannot be launched when the line is obtained are considered as lost.
The evolution of the orders is similar to that of the products, since we assumed a constant consumption. The increases in production capacity occur after the launching of new products, and also when there are production tensions; they are always limited by the cash situation. The decreases occur as a result of the obsolescence of machinery. As we have not assumed the existence of appreciable stocks, the real deliveries always coincide with either the orders or the production capacity, whichever is lower. We can see below the components of turnover, which are deliveries and prices. The evolution of the deliveries is the same as that shown in the above table.
The prices show a saw tooth progression, since the maximum price is obtained on the launching of the lines of products, which is when the difference between real quality of the products and scientific level of the environment is maximum, and then immediately begins to decrease.
We can see a certain tendency to growth as a consequence of the company working in products with a greater and greater quality and price. As a result of the evolution of the deliveries and prices we obtain the evolution of the turnover, which is highly influenced by the launching of new products and by gradual reductions in prices. One of the parameters which best characterizes these companies is the ratio of R+D expenses to turnover. As the R+D expenses have relatively little elasticity, their importance tends to decrease as the company increases its volume of turnover. To a certain extent we can see how the innovating companies, measured according to this ratio, tend to stop being innovative as they increase in size.
In the bibliography it is often stated that innovating companies are generally small in size, without giving an explanation for this. We show here the evolution of the real profit, which is highly dependent on turnover, and the evolution of the desired profit, which is highly dependent on the value of the fixed assets. We can see how scientific staff are laid off in the stages when the desired profit exceeds the real profit. We can see here the closely related evolution of net worth, fixed assets and liquidity. The initial net worth is the capital. This increases according to the profit obtained and the policy of capitalization. In the first phase the capital is the amount of cash, which decreases as a consequence of the expenditure on R+D. When new lines of products are obtained, a large part of this cash is transformed into fixed assets. The operating profit or profit margin of turnover shows a discontinuous evolution, with peaks on the launching of new lines of products and progressive decreases resulting from the price reductions we saw above.
SUMMARY: THE EVOLUTION OF INNOVATORY COMPANIES
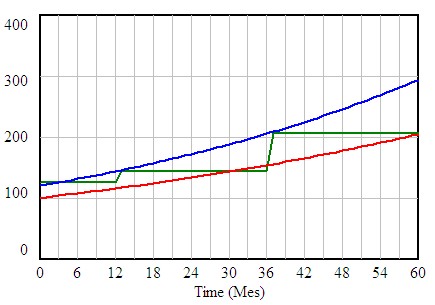
In summary, we could say that the model of innovating companies we created has allowed us to observe behaviours which cannot be appreciated in the administrative charts, in the descriptions of processes, or in the plant distribution. We can thus say that the evolution of these companies lies within a range of possibilities limited by the upper and lower curve of the next graph.
In this figure the central curve shows the theoretical evolution, measured in turnover, of a company that manages to maintain a constant number of customers and a constant price. Its evolution in steps responds to the appearance of successive lines of products.
The lower line shows this same company in the case when it is forced to progressively reduce the price of its products, working in a closed niche of customers.
Lastly, besides the step effect and the phenomenon of price reduction, the upper curve shows an increase in the number of customers, which makes it possible to compensate for price re
In this work we can see the distinguishing characteristics of innovating companies and the steps followed in the construction of the model, the structure of the latest version, the behaviour obtained from this structure and the simulations and analyses of sensitivity that have been made. Lastly, they are explained the most suitable policies and the objectives which should be followed by innovating companies.
The specialists and the bibliography that deal with this subject indicate that the distinguishing characteristics of innovating companies are: small size, environment with rapidly changing technology, high technological risk, need for investment in R+D, government aid policies and programs, difficulty of access to raw materials, difficulty in obtaining qualified staff, difficulty in the channels of distribution, markets without protective borders, attractive margins, financial difficulties, and need for government aid.
The model is divided into three main areas: the R+D Area, the Production and Market Area, and the Financial and Management Area. We can see how the R+D expenses make it possible to employ scientific staff who generate lines of production which lead to deliveries based on the current production capacity. Moreover, the quality of the products influences the price, and this, combined with the deliveries, defines the turnover. The turnover makes it possible to obtain a profit.
The cash situation limits the volume of the production capacity. In turn the fixed assets, which is the accounting expression for the production capacity, influence the desired profit. When this is higher than the real profit, there tend to be cuts in the R+D expenditure. Although I will explain the main elements below, an overall view allows us to observe the existence of positive and negative loops. The former will by themselves lead the company to an exponential growth or a rapid collapse. The latter will act as stabilizers of the former.
We can clearly see the inputs and outputs of each area. Thus, the R+D Area receives the input of the R+D expenditure from the Finance and Management Area, giving as an output products of a certain quality. the Production and Market Area receives these outputs, together with the cash situation, and gives as an output deliveries at a certain price and production capacity. Lastly, on the basis of these inputs the Financial and Management Area offers a given R+D expenditure as an output. We will now see the main elements and relations of the model.
THE RESEARCH AND DEVELOPMENT AREA
This is a key area in the model, showing the elements which affect the generation of products. It includes:
Scientific staff: These are persons who may be employed on the basis of the R+D expenditure. It is divided into two groups, the Scientific Staff devoted to R+D and the Scientific Staff devoted to production. Although initially all the scientific staff are devoted to R+D, after the launching of the first line of products they are divided into two groups.
Scientific progress: The scientific progress of the company develops on the basis of the number of employees devoted to research, and is hindered by the scientific difficulty of the chosen area of work and by the scientific level of the R+D work of the company.
Scientific difficulty: The degree of scientific difficulty of the area in which the company wishes to introduce its products, which may be high if it wishes to offer products with the latest technology, or low otherwise.
Scientific level: The scientific advances of the environment. Supposing that there is a fluid relation with the environment, the scientific level of the company increases according to both the scientific advances of the company and the advances in the environment. It is initially higher than that of its environment because it includes research previous to the creation of the company.
Potential quality of the products: This evolves according to the scientific level of the company and the advances in production quality. The increase in lines of products leads to diseconomies which lead to lower increases in quality.
Real quality: This is equal to the potential quality at the time the line of products is launched, and is considered not to vary until the launching of a new line.
Quality gap: Is the percentage by which the technological quality of the company's products exceeds that of the environment. This gap has a clear influence on the price of the product.
Non-applied technological gap: This includes the research efforts devoted to creating a new line of products. It has not yet been applied as the desired technological advantage over the knowledge of the environment has not yet been reached. This increases according to the difference between the scientific level of the company and the scientific level of the environment. It diminishes as the product lines are applied.
Product lines: This indicates the number of lines which have been successful and serve as a basis for creation of products. In these companies the products are not generated in isolation, and one product type generates a diversity of products which meet the most common requirements of the customers. Product lines are generated when the Non-applied Technological Gap exceeds the scientific level of the environment by a desired value. This constant permits the simulation of different positions of entry in the market.
Products: After a line has been obtained, the products generated are no more than different applications of a single scientific base - the line of research - for the specific problems of the customers. This variable covers the products which are marketed, not those which may be marketed, as the volume of investment is limited. Thus, products are only launched while the cash available makes it possible to finance the new investments in fixed assets. Due to the dynamism of this sector, it is supposed that products not launched a certain time after the line of research has finished will not remain in the portfolio, and the company loses the opportunity to launch them. The flow of products shows a brief delay with regard to the appearance of the product lines.
PRODUCTION AND MARKET AREA
This area contains the main aspects of production and sales.
Production capacity: This increases according to the launching of products. The production capacity determines the flow of deliveries, since production stocks are not considered to be significant.
Orders: These are calculated on the basis of the number of products, the number of customers and their consumption. A constant unit consumption per customer is assumed during the period studied.
Deliveries: This coincides with the volume of orders if the production capacity so permits. Orders which exceed the capacity are considered as lost. If the orders exceed the production capacity, this leads to what we will call Production Tension. The cash situation permitting, after a certain delay this tension will lead to an extension of the production capacity.
Price: It is considered that the company cannot significantly influence the reference price, but it can obtain a higher or lower price according to the quality gap of its products.
Customers: This deals with the number of customers of the company. The company starts to find customers in the desired niche after obtaining the first product line.
Fixed Assets: The value of the investments in fixed assets such as machinery and installations. It is difficult to find outside finance for these investments, and the company must therefore use its own capital. The fixed assets increase according to increases in the production capacity, and decrease according to amortization and the official aid received. They are of great importance in the calculation of the desired profit.
FINANCE AND MANAGEMENT AREA
This deals with the accounting and management aspects of the company. The basic aspects are:
Turnover: The deliveries times the price.
Profit: The concept of operating profit. It is calculated by subtracting from the turnover the cost of raw materials, the cost of production staff, the general expenses - which include research and marketing - and depreciation. Neither cash income nor expenses are considered as they distort the indicators of the evolution of the company with external factors, without making a significant contribution. They are not considered as financial costs since this type of company is unlikely to find outside finance when they have to face liquidity problems.
Cost of raw materials and the cost of production staff: These are fixed percentages of turnover. It has been considered that two aspects come together at this point: firstly, a certain experience curve should permit a lower consumption of raw materials and labor; secondly, price of products reductions must be taken into account. The combination of these two aspects allows us to establish fixed percentages of turnover.
Net Worth: This is the net book value of the company at any given time, as the sum of the initial capital plus the annual profits, according to the policy of profit distribution. According to the profit distribution policy, the model calculates the profit to be carried to net worth when the profit is positive, and apportions losses when they occur.
Profit distribution: This deals with the company policy of distribution or reinvestment of profits.
Desired Profitability: This percentage is applied to the net worth of the fixed assets, in order to obtain the desired profit.
Profit Gap: The relative difference between the desired profit and the real profit.
Liquidity: The net worth not applied to fixed assets. According to the net worth, this establishes the maximum amount of fixed assets which the company can acquire, so that by financial orthodoxy the fixed assets are not financed with outside funds.
General expenses: Expenses of research and marketing. This also includes repayment of official aid received for research, since, unlike aids for investment, this is in the form of loans.
Loans for research and development: The amount that the company devotes to R+D. Added to the net official aid to R+D, this comes to the R+D expenditure. The management of the company may alter the R+D budgets with a certain elasticity. The reasons for altering the R+D budget lie in the gap between the real and desired profits. Thus, when the real profit does not reach its objectives, the management tends to reduce the R+D budgets, and when it exceeds them it does the opposite.
Marketing: The expenditure needed to publicize the products and inform potential customers of their characteristics. This depends on the number of products and the customer niche.
Desired niche: The group of customers to which the company wishes to aim its products. It may be very wide, with high marketing costs, distribution networks, etc., or very small,so that the proximity of the company gives it a decisive competitive advantage over others.
Official aid to R+D: Five-year interest-free loans, up to 50% of the costs of the R+D project.
R+D costs: Includes the R+D budget, plus net official aid, i.e. the input of aid plus the return of the loans received.
Lastly, two indicators of the situation of the company are obtained:
Margin: This is calculated as a percentage of Profit/ turnover.
R+D costs/Turnover: As the study deals with innovating companies, the ratio of R+D to Turnover can give us an idea of the importance of this factor in the running of the company.
BEHAVIOUR
Leaving aside the period in which the founders of the company carry out the initial research and market research and manage to find the necessary capital, we can observe three clearly differentiated stages.
The first begins when the company starts to operate, and lasts until the first product line is obtained. It is characterized by intensive R+D activity focused exclusively on solving scientific problems so that the company can obtain a certain line of products or services. The only challenge is to obtain the first line of products before the initial capital is exhausted.
The second stage is marked by the launching of the first line of products. This stage is characterized by the need to acquire production machinery, recruit new production staff, start production and transfer scientific staff from R+D to production. Marketing and sales costs must also be met. This is all dealt with in an environment of serious cash limitations and capital. The challenge thus lies in creating a production structure in an environment of serious financial difficulties.
The third stage is marked by the birth of new product lines. In this stage there arise problems of distribution of the resources which the company is generating between the different agents who require them. The area of R+D will also request more funds to recover the initial levels of research, the area of production will request funds to increase its production capacity and close the gap between sales and production, and the representatives of the capital, after a long wait, will wish to obtain a high remuneration for the risky investment that they have made. Indeed, the final challenge consists in achieving an effective distribution of the resources.
We will now take a brief look at the evolution of the main elements of the model over a period of 120 months, or 10 years. Firstly, we can see the evolution of the scientific staff. Their behaviour is highly influenced by the obtaining of the first line of products. At this time two phenomena occur: some of them begin to be laid off due to the investments and expenses the company must make and others are redistributed, some of them being transferred from R+D to production.
Let us now see the evolution of the scientific level of the company, the scientific level of the environment, the potential quality and the real quality. The scientific level of the environment is approximately doubled in 10 years and, as a result of the company's research, the scientific level of the company is always above that of the environment. The potential quality of the products is lower than the company's scientific level, since the products cannot incorporate all the company's knowledge. The real quality coincides with the potential quality at the time when new lines of products are launched.
We can see how the quality gap between the real quality and the scientific level of the environment is at a maximum after the launching of new lines of products, and then decreases. Lines of products appear successively when the scientific level of the company is higher than the scientific level of the environment, according to the concept of the Non-applied Technological Gap defined above. The products are generated after new lines are obtained. The number of these varies according to the availability of cash. The products which cannot be launched when the line is obtained are considered as lost.
The evolution of the orders is similar to that of the products, since we assumed a constant consumption. The increases in production capacity occur after the launching of new products, and also when there are production tensions; they are always limited by the cash situation. The decreases occur as a result of the obsolescence of machinery. As we have not assumed the existence of appreciable stocks, the real deliveries always coincide with either the orders or the production capacity, whichever is lower. We can see below the components of turnover, which are deliveries and prices. The evolution of the deliveries is the same as that shown in the above table.
The prices show a saw tooth progression, since the maximum price is obtained on the launching of the lines of products, which is when the difference between real quality of the products and scientific level of the environment is maximum, and then immediately begins to decrease.
We can see a certain tendency to growth as a consequence of the company working in products with a greater and greater quality and price. As a result of the evolution of the deliveries and prices we obtain the evolution of the turnover, which is highly influenced by the launching of new products and by gradual reductions in prices. One of the parameters which best characterizes these companies is the ratio of R+D expenses to turnover. As the R+D expenses have relatively little elasticity, their importance tends to decrease as the company increases its volume of turnover. To a certain extent we can see how the innovating companies, measured according to this ratio, tend to stop being innovative as they increase in size.
In the bibliography it is often stated that innovating companies are generally small in size, without giving an explanation for this. We show here the evolution of the real profit, which is highly dependent on turnover, and the evolution of the desired profit, which is highly dependent on the value of the fixed assets. We can see how scientific staff are laid off in the stages when the desired profit exceeds the real profit. We can see here the closely related evolution of net worth, fixed assets and liquidity. The initial net worth is the capital. This increases according to the profit obtained and the policy of capitalization. In the first phase the capital is the amount of cash, which decreases as a consequence of the expenditure on R+D. When new lines of products are obtained, a large part of this cash is transformed into fixed assets. The operating profit or profit margin of turnover shows a discontinuous evolution, with peaks on the launching of new lines of products and progressive decreases resulting from the price reductions we saw above.
SUMMARY: THE EVOLUTION OF INNOVATORY COMPANIES
In summary, we could say that the model of innovating companies we created has allowed us to observe behaviours which cannot be appreciated in the administrative charts, in the descriptions of processes, or in the plant distribution. We can thus say that the evolution of these companies lies within a range of possibilities limited by the upper and lower curve of the next graph.
In this figure the central curve shows the theoretical evolution, measured in turnover, of a company that manages to maintain a constant number of customers and a constant price. Its evolution in steps responds to the appearance of successive lines of products.
The lower line shows this same company in the case when it is forced to progressively reduce the price of its products, working in a closed niche of customers.
Lastly, besides the step effect and the phenomenon of price reduction, the upper curve shows an increase in the number of customers, which makes it possible to compensate for price re
|

 See the book