4.11. HOW TO GROW THE PRODUCTIVITY
A simulation model with Vensim
 The conflict that exists between the long-term and short-term solutions is something common in most systems, in the way that effective short-term solutions are not effective in the long-term and vice versa. In the business world for instance, the limitations of preventative maintenance policies are well known. Although they are vital in the medium term, in the short term they cause breaks in the production that nobody wants to assume.
Similarly, in the quality environment, the obedience of strict quality control rules is the basis in order to achieve a prestigious reputation with their clients. This can be understood in the medium term as achieving the trust of the clients and a bigger commercial margin. Nevertheless, a strict policy of quality control in the short term causes a rise in costs if merchandise that doesn't follow the norms is disposed of.
In the personnel training environment, an increase of hours dedicated to this activity increases productivity, quality and results in the company in the medium term. However, in the short-term, this implies higher costs and a reduction in the availability of staff available to work in the production.
Inside the company we can also observe this situation in the need to increase the strength of the improvements in the production processes, and with this increase the future productivity in the medium-term, or in other words dedicate all the available efforts to dealing with the immediate needs of production. We can see an excellent approximation to the theme in the article: "Nobody Ever Gets Credit for Fixing a Problem that Never Happened" by Nelson P. Repenning and John D. Sterman (2001).
The basic cause of this conflict between short and long-term can be found in the fact that certain actions give immediate results while others there is a significant delay before the results can be seen.
This practical exercise attempts to illustrate the reality. It also attempts to show the usefulness of the causal diagram as an instrument to analyse a situation characterised by the existence of loops of feedback and delay.
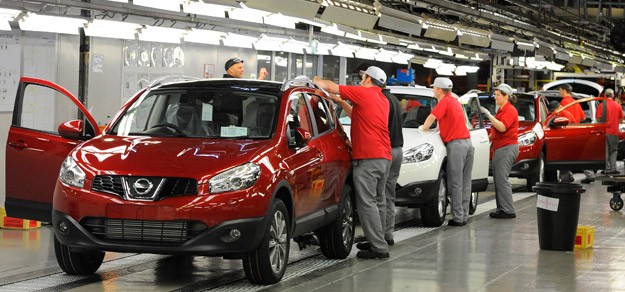
The group of the Project Columbus 07 is owned by a company that is dedicated to the development of aerospace software and is formed of IT technicians. Each employee has a great deal of autonomy in relation to the quantity of hours worked each week. The employees also have freedom to distribute these hours between three basic tasks. On one hand the production of IT programmes to deal with current projects and on the other hand the analysis of IT tools - training in order to improve productivity. As this sector is very dynamic it is important to dedicate a lot of hours to the improvements of productivity because technology can quickly become obsolete.
Every week, the employees receive comparative information between the real production and the desired production that they develop. Based on the difference of production perceived, pressure is applied to vary the production. This pressure can be understood in terms of an immediate adjustment to the working hours in production. Pressure is also applied to improve the productivity as a key aspect, in this way it is intended that more hours are planned for productivity.
The causal diagram formed by elements signalled in bold in the previous paragraphs allows us to illustrate this situation. We can identify two loops of feedback with the names "work more" and "work better".
We can observe that they are two negative curves as they only have a negative relation. They compare the state of the real production with the state of the desired production. The real state is adjusted using two different processes: the variation of the working hours - that allow immediate increases in production - and the improvement in productivity - which requires more time to show its effects.
The existence of a delay in the curve "work better" will cause the other curve "work more" to be the most active and the curve which offers results the quickest. It is for this reason that in companies that have high production targets, more emphasis is put on increasing the working hours rather that trying to increase the productivity
We are going to transform the causal diagram into a flow diagram in order to be able work with the model in the computer. The necessary transformations will be minimal. The only change will be to define the levels of productivity and the working hours in production or in improvement of productivity. We will consider that the last two variables will change according to the pressure that each one receives.
Now we need to have some additional information available to create the equations of the model. We will consider that the employee usually dedicates35 hours a week to production tasks and 5 hours to tasks that improve productivity. The desired production is 3500 units. The productivity per working hour is 100 units/week. It is estimated that 20 weeks of delay exists between the hours dedicated to improve the productivity and in the moment when this is manifested.
With the previous distribution of the hours it can be observed that the productivity is stable, with loses due to obsolescence and balanced improvements in the equivalent of 5 lines/week. With these indications we can formulate the equations of the model.
We take as pressure to improve the production, the units that exist as difference divided by the productivity initial, 100. The pressure to improve the productivity has to be much lower, as immediate results are not expected, and for this reason we take a factor of 5 times the value of the productivity.
With these parameters we observe that all the elements of the system and especially the productivity remain constants. It is important to have a model that represents the system in balance in order to appreciate better the effect of the changes in its structure or conditions.
We can observe the following behaviour, and in summary, an increase in the desired production becomes firstly an increase in the working hours in production. Also, a pressure to increase the productivity is increased. As this improves, the number of working hours can be reduced.
This model allows us to explain the reality of many companies, where although occasional efforts of production are needed , the progressive improvements of productivity allow the return to the initial situation after a certain time. On the contrary, on other occasions we find that the pressure to increase the production influences the hours dedicated to the improvement of productivity. This causes a progressive decrease in the level of productivity which in turn mean that more hours of work are necessary. A curve appears every time employees feel obliged to work more as the productivity continues to descend.
Furthermore, the employee observes that if he dedicates less hours to improving productivity, he has more hours available to work on production. With this the difference between the real production and the desired receive less pressure of all kinds. We can see these behaviours represented by the darkest arrows in the diagram.
In the first equations we need to take into consideration the pressure to vary the production, reducing its proportion in relation to the pressure to improve productivity. SO although it acts, it doesn't manage to annul. In the second equation we need to include the effect of the hours spent in improvement of productivity. Initially, there were 5 hours.
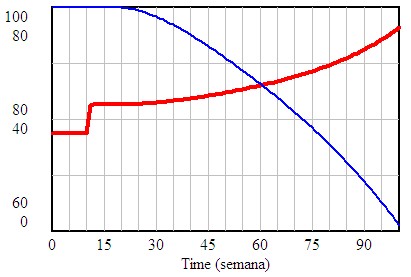
The dynamics that these new relations generate are especially attractive in the short term as the real production can be adjusted to the desired production very quickly. But in the medium term, it would be counterproductive because the obsolescence of the productivity isn't compensated by new improvements. In this way we can observe how the productivity shows a progressive decrease as an increase in the hours dedicated to production
In conclusion we can observe how the natural tendency of the system could be to correct the differences between the desired production and the real based on successive recourse to "work more". This situation is logical as it achieves the desired effect quickly. Nevertheless, if the method of "working more" impedes the necessary process to work better, it is inevitable that more and more hours will be needed owing to the drop in productivity.
The conflict that exists between the long-term and short-term solutions is something common in most systems, in the way that effective short-term solutions are not effective in the long-term and vice versa. In the business world for instance, the limitations of preventative maintenance policies are well known. Although they are vital in the medium term, in the short term they cause breaks in the production that nobody wants to assume.
Similarly, in the quality environment, the obedience of strict quality control rules is the basis in order to achieve a prestigious reputation with their clients. This can be understood in the medium term as achieving the trust of the clients and a bigger commercial margin. Nevertheless, a strict policy of quality control in the short term causes a rise in costs if merchandise that doesn't follow the norms is disposed of.
In the personnel training environment, an increase of hours dedicated to this activity increases productivity, quality and results in the company in the medium term. However, in the short-term, this implies higher costs and a reduction in the availability of staff available to work in the production.
Inside the company we can also observe this situation in the need to increase the strength of the improvements in the production processes, and with this increase the future productivity in the medium-term, or in other words dedicate all the available efforts to dealing with the immediate needs of production. We can see an excellent approximation to the theme in the article: "Nobody Ever Gets Credit for Fixing a Problem that Never Happened" by Nelson P. Repenning and John D. Sterman (2001).
The basic cause of this conflict between short and long-term can be found in the fact that certain actions give immediate results while others there is a significant delay before the results can be seen.
This practical exercise attempts to illustrate the reality. It also attempts to show the usefulness of the causal diagram as an instrument to analyse a situation characterised by the existence of loops of feedback and delay.
The group of the Project Columbus 07 is owned by a company that is dedicated to the development of aerospace software and is formed of IT technicians. Each employee has a great deal of autonomy in relation to the quantity of hours worked each week. The employees also have freedom to distribute these hours between three basic tasks. On one hand the production of IT programmes to deal with current projects and on the other hand the analysis of IT tools - training in order to improve productivity. As this sector is very dynamic it is important to dedicate a lot of hours to the improvements of productivity because technology can quickly become obsolete.
Every week, the employees receive comparative information between the real production and the desired production that they develop. Based on the difference of production perceived, pressure is applied to vary the production. This pressure can be understood in terms of an immediate adjustment to the working hours in production. Pressure is also applied to improve the productivity as a key aspect, in this way it is intended that more hours are planned for productivity.
The causal diagram formed by elements signalled in bold in the previous paragraphs allows us to illustrate this situation. We can identify two loops of feedback with the names "work more" and "work better".
We can observe that they are two negative curves as they only have a negative relation. They compare the state of the real production with the state of the desired production. The real state is adjusted using two different processes: the variation of the working hours - that allow immediate increases in production - and the improvement in productivity - which requires more time to show its effects.
The existence of a delay in the curve "work better" will cause the other curve "work more" to be the most active and the curve which offers results the quickest. It is for this reason that in companies that have high production targets, more emphasis is put on increasing the working hours rather that trying to increase the productivity
We are going to transform the causal diagram into a flow diagram in order to be able work with the model in the computer. The necessary transformations will be minimal. The only change will be to define the levels of productivity and the working hours in production or in improvement of productivity. We will consider that the last two variables will change according to the pressure that each one receives.
Now we need to have some additional information available to create the equations of the model. We will consider that the employee usually dedicates35 hours a week to production tasks and 5 hours to tasks that improve productivity. The desired production is 3500 units. The productivity per working hour is 100 units/week. It is estimated that 20 weeks of delay exists between the hours dedicated to improve the productivity and in the moment when this is manifested.
With the previous distribution of the hours it can be observed that the productivity is stable, with loses due to obsolescence and balanced improvements in the equivalent of 5 lines/week. With these indications we can formulate the equations of the model.
We take as pressure to improve the production, the units that exist as difference divided by the productivity initial, 100. The pressure to improve the productivity has to be much lower, as immediate results are not expected, and for this reason we take a factor of 5 times the value of the productivity.
With these parameters we observe that all the elements of the system and especially the productivity remain constants. It is important to have a model that represents the system in balance in order to appreciate better the effect of the changes in its structure or conditions.
We can observe the following behaviour, and in summary, an increase in the desired production becomes firstly an increase in the working hours in production. Also, a pressure to increase the productivity is increased. As this improves, the number of working hours can be reduced.
This model allows us to explain the reality of many companies, where although occasional efforts of production are needed , the progressive improvements of productivity allow the return to the initial situation after a certain time. On the contrary, on other occasions we find that the pressure to increase the production influences the hours dedicated to the improvement of productivity. This causes a progressive decrease in the level of productivity which in turn mean that more hours of work are necessary. A curve appears every time employees feel obliged to work more as the productivity continues to descend.
Furthermore, the employee observes that if he dedicates less hours to improving productivity, he has more hours available to work on production. With this the difference between the real production and the desired receive less pressure of all kinds. We can see these behaviours represented by the darkest arrows in the diagram.
In the first equations we need to take into consideration the pressure to vary the production, reducing its proportion in relation to the pressure to improve productivity. SO although it acts, it doesn't manage to annul. In the second equation we need to include the effect of the hours spent in improvement of productivity. Initially, there were 5 hours.
The dynamics that these new relations generate are especially attractive in the short term as the real production can be adjusted to the desired production very quickly. But in the medium term, it would be counterproductive because the obsolescence of the productivity isn't compensated by new improvements. In this way we can observe how the productivity shows a progressive decrease as an increase in the hours dedicated to production
In conclusion we can observe how the natural tendency of the system could be to correct the differences between the desired production and the real based on successive recourse to "work more". This situation is logical as it achieves the desired effect quickly. Nevertheless, if the method of "working more" impedes the necessary process to work better, it is inevitable that more and more hours will be needed owing to the drop in productivity.
|

 See the book