4.6. PRODUCTION OF PORK PRODUCTS. A STUDY OF HOGS
A simulation model with Vensim
 Many systems tend to oscillate in response to external disturbances. The national economy, for example, shows cycles of high and low Gross National Product and employment. And animal populations (such as rabbits and lynx) often exhibit oscillations.
In this exercise we will explore a example of cyclical behaviour: the production and consumption of pork products in Spain. While the pork example is interesting in itself, it is also important because it focuses on some general questions about the nature of oscillations and the stability of systems in response to disturbances.
The production and consumption of pork products involve three groups of actors: farmers, butchers, and consumers. Butchers buy hogs from farmers, "dress" the hogs to obtain pork products, and then sell the pork products to consumers.
In order to understand the cycles that take place in the production and consumption of pork products, it will be helpful to build two models - one focusing on the process of breeding and fattening hogs on the farm, and the other focusing on the sale of pork products. Then the two models can be combined to generate cyclical behaviour. It is easiest to begin with a model of the sale of pork products, then turn to the breeding of hogs, and finally combine the two models into one larger model and analyze the behaviour the combined model generates.
Model 1: The Sale and Consumption of Pork
The main element in the model of the sale of pork is the inventory of pork maintained by butchers. When hogs are slaughtered on the farm, the pork products that are produced are added to the inventory kept by butchers; when pork is sold, that pork is taken from the inventory. The amount of pork people buy depends on the price of pork; the price of pork, in turn, depends on the size of the pork inventory. When the inventory is high, prices fall; when the inventory is low, prices rise.
We will assume that the number of hogs slaughtered each month is a constant: 750,000 hogs per month. Hogs weigh about 100 kilos each, and the "dressed yield" of pork is about 80 percent (this means that each hog produces 0.80*100= 80 kilos of pork). Thus a slaughter rate of 750,000 hogs per month corresponds to a pork production rate of 60 million kilos of pork each month.
On the average, each person in Spain normally consumes about 1.5 kilos of pork each month. With a population of 40 million people, the total amount of pork normally consumed each month is 1.5*40 million = 60 million kilos of pork per month. But when the price is relative to the normal price of pork, people usually consume somewhat than 1.5 kilos each month; when the price is low, they consume somewhat more.
The price of pork depends on the price of hogs, and the price of hogs depends on supply and demand. Assume that butchers try to keep on hand about 2 weeks' worth of the amount of pork products they usually sell. When the available inventory of pork runs low, relative to their normal inventory, butchers are willing to pay higher prices to get hogs. When the butchers' inventory of pork is high, butchers are less willing to buy and the price of hogs falls.
Assume that the normal price of hogs at slaughter is 3 euros per kilo. Assume that butchers charge consumers 7 euros per kilo on pork. Thus when the price of hogs is at its normal value, the price of pork to consumers is 10 euros/kilo. Now, draw the flow diagram of the sale and consumption of pork, and write equations for the model. Put the equation of Test = 0 and see if the model is in equilibrium. If not, you make a mistake in the equations :-) Once you have obtained a model that runs in equilibrium, try testing its response to exogenous disturbances. For example, how does the system respond to a 6 month 10.000 increment in the hog slaughter rate? (you can do this using the function PULSE(6,6)*10000)
Model 2: The Breeding and Maturation of Hogs
In Model 1 we assumed the hog slaughter rate was an exogenous constant. Now let's develop a model of the breeding and maturation of hogs to simulate the slaughter rate. For this model, we will assume that the price of hogs is an exogenous constant. In Model 3, we will combine the two models to simulate both the hog price and the slaughter rate.
Farmers distinguish between two kinds of hogs: hogs for market and hogs for breeding stock. Hogs for market (which can be either male or female) are fattened for about 6 months after they are born, and then they are slaughtered. Females intended for market are not bred. Females to be bred (called sows) are raised separately as "breeding stock," and they are used entirely for breeding. we will assume that they are not slaughtered for pork.
Farmers change the size of their hog herd by adjusting the number of sows in their breeding stock. When the price of hogs is higher than normal, farmers increase the size of the breeding stock, and when the price of hogs is lower than normal, they decrease the size of the breeding stock.
Draw the flow diagram and write the equations for the model of the breeding and maturation of hogs. Assume that each sow gives birth to 18 hogs per year (1.5 per month). Also, assume that hogs must be fattened for 6 months before they are ready for market. The most difficult part of the model is the "breeding stock adjustment rate." We will formulate this using a "desired breeding stock size" as a function of hog price. This adjustment can be expressed most easily as a percentage of the actual breeding stock size. The breeding stock adjustment rate can then be formulated as the difference between the "desired size" and the "actual size," divided by an adjustment time. Set the hog price at 3 euros/kilo. We will choose values for the breeding stock and for number of hogs that will produce an equilibrium slaughter rate of 750,000 hogs per month (the value we assumed in Model 1.)
Model 3: Combining the Two Models
Now let's merge the models developed. To do this, all that is necessary is to use the hog price from model 1 in place of the hog price in model 2, and the slaughter rate from model 2 in place of the slaughter rate in model 1. Run the model and examine the results. If you use the same initial values as those you chose in Models 1 and 2 (with test=0), the model should be in equilibrium.
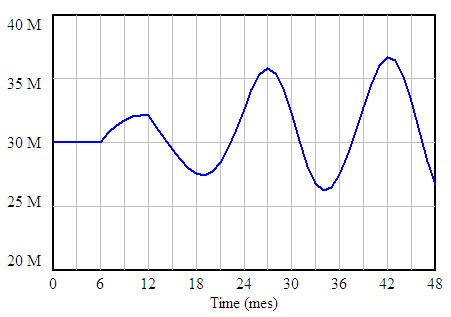
Once you have obtained an equilibrium run, you can test the model's response to external disturbances. For example, activate the test as you did in model 1 . What happens? Can you explain why the cycles occur?
Two features of cyclical behaviour are particularly important: period and damping. The period of a cycle is the time that elapses from one peak to the next. Damping refers to the degree to which oscillations fade away over time. For the parameter values we have chosen, the hog model produces stable oscillations.
Many systems tend to oscillate in response to external disturbances. The national economy, for example, shows cycles of high and low Gross National Product and employment. And animal populations (such as rabbits and lynx) often exhibit oscillations.
In this exercise we will explore a example of cyclical behaviour: the production and consumption of pork products in Spain. While the pork example is interesting in itself, it is also important because it focuses on some general questions about the nature of oscillations and the stability of systems in response to disturbances.
The production and consumption of pork products involve three groups of actors: farmers, butchers, and consumers. Butchers buy hogs from farmers, "dress" the hogs to obtain pork products, and then sell the pork products to consumers.
In order to understand the cycles that take place in the production and consumption of pork products, it will be helpful to build two models - one focusing on the process of breeding and fattening hogs on the farm, and the other focusing on the sale of pork products. Then the two models can be combined to generate cyclical behaviour. It is easiest to begin with a model of the sale of pork products, then turn to the breeding of hogs, and finally combine the two models into one larger model and analyze the behaviour the combined model generates.
Model 1: The Sale and Consumption of Pork
The main element in the model of the sale of pork is the inventory of pork maintained by butchers. When hogs are slaughtered on the farm, the pork products that are produced are added to the inventory kept by butchers; when pork is sold, that pork is taken from the inventory. The amount of pork people buy depends on the price of pork; the price of pork, in turn, depends on the size of the pork inventory. When the inventory is high, prices fall; when the inventory is low, prices rise.
We will assume that the number of hogs slaughtered each month is a constant: 750,000 hogs per month. Hogs weigh about 100 kilos each, and the "dressed yield" of pork is about 80 percent (this means that each hog produces 0.80*100= 80 kilos of pork). Thus a slaughter rate of 750,000 hogs per month corresponds to a pork production rate of 60 million kilos of pork each month.
On the average, each person in Spain normally consumes about 1.5 kilos of pork each month. With a population of 40 million people, the total amount of pork normally consumed each month is 1.5*40 million = 60 million kilos of pork per month. But when the price is relative to the normal price of pork, people usually consume somewhat than 1.5 kilos each month; when the price is low, they consume somewhat more.
The price of pork depends on the price of hogs, and the price of hogs depends on supply and demand. Assume that butchers try to keep on hand about 2 weeks' worth of the amount of pork products they usually sell. When the available inventory of pork runs low, relative to their normal inventory, butchers are willing to pay higher prices to get hogs. When the butchers' inventory of pork is high, butchers are less willing to buy and the price of hogs falls.
Assume that the normal price of hogs at slaughter is 3 euros per kilo. Assume that butchers charge consumers 7 euros per kilo on pork. Thus when the price of hogs is at its normal value, the price of pork to consumers is 10 euros/kilo. Now, draw the flow diagram of the sale and consumption of pork, and write equations for the model. Put the equation of Test = 0 and see if the model is in equilibrium. If not, you make a mistake in the equations :-) Once you have obtained a model that runs in equilibrium, try testing its response to exogenous disturbances. For example, how does the system respond to a 6 month 10.000 increment in the hog slaughter rate? (you can do this using the function PULSE(6,6)*10000)
Model 2: The Breeding and Maturation of Hogs
In Model 1 we assumed the hog slaughter rate was an exogenous constant. Now let's develop a model of the breeding and maturation of hogs to simulate the slaughter rate. For this model, we will assume that the price of hogs is an exogenous constant. In Model 3, we will combine the two models to simulate both the hog price and the slaughter rate.
Farmers distinguish between two kinds of hogs: hogs for market and hogs for breeding stock. Hogs for market (which can be either male or female) are fattened for about 6 months after they are born, and then they are slaughtered. Females intended for market are not bred. Females to be bred (called sows) are raised separately as "breeding stock," and they are used entirely for breeding. we will assume that they are not slaughtered for pork.
Farmers change the size of their hog herd by adjusting the number of sows in their breeding stock. When the price of hogs is higher than normal, farmers increase the size of the breeding stock, and when the price of hogs is lower than normal, they decrease the size of the breeding stock.
Draw the flow diagram and write the equations for the model of the breeding and maturation of hogs. Assume that each sow gives birth to 18 hogs per year (1.5 per month). Also, assume that hogs must be fattened for 6 months before they are ready for market. The most difficult part of the model is the "breeding stock adjustment rate." We will formulate this using a "desired breeding stock size" as a function of hog price. This adjustment can be expressed most easily as a percentage of the actual breeding stock size. The breeding stock adjustment rate can then be formulated as the difference between the "desired size" and the "actual size," divided by an adjustment time. Set the hog price at 3 euros/kilo. We will choose values for the breeding stock and for number of hogs that will produce an equilibrium slaughter rate of 750,000 hogs per month (the value we assumed in Model 1.)
Model 3: Combining the Two Models
Now let's merge the models developed. To do this, all that is necessary is to use the hog price from model 1 in place of the hog price in model 2, and the slaughter rate from model 2 in place of the slaughter rate in model 1. Run the model and examine the results. If you use the same initial values as those you chose in Models 1 and 2 (with test=0), the model should be in equilibrium.
Once you have obtained an equilibrium run, you can test the model's response to external disturbances. For example, activate the test as you did in model 1 . What happens? Can you explain why the cycles occur?
Two features of cyclical behaviour are particularly important: period and damping. The period of a cycle is the time that elapses from one peak to the next. Damping refers to the degree to which oscillations fade away over time. For the parameter values we have chosen, the hog model produces stable oscillations.
|

 See the book